


Key Performance Indicators
Access to Medicines
Global programs and commercial transactions to increase access to medicines in emerging markets1,2
Top 21 global burdens of disease addressed by products and pipeline3
Overview3
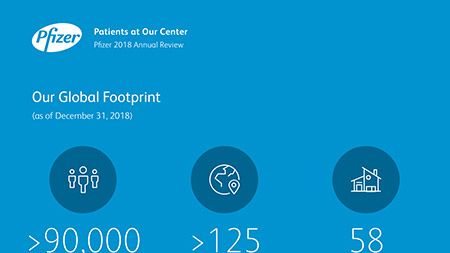
- We currently have 285 active programs for launched medicines in markets.
- This covers 53 countries.
- Of these, 16 programs cover multiple therapies while the rest are product specific.
- In total, these cover 104 different products in our portfolio.
- Program/commercial transaction defined as a Pfizer investment or dedicated contract of over $250,000 with a national government or procurement agency, multilateral organization, non-governmental organization, private institution or aid agency. Represents multi-country initiatives only and does not include numerous local initiatives to address access.
- Pfizer Foundation programs represent aggregate investment in program areas with several NGO partners.
- As defined by the World Health Organization. Burdens of illness not addressed include unintentional injuries, transport injuries, malaria & neglected tropical diseases, self-harm, and interpersonal violence.
- The number of patient access programs with pricing tailored to different patient segments (for at least one product), allowing access for more patients.
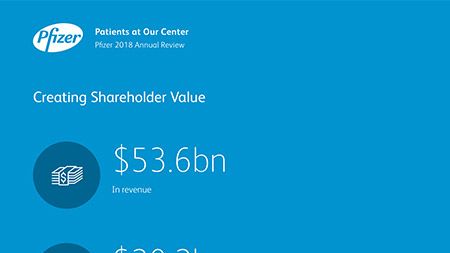
- Total Revenue (PIH+PEH)
- Alliance Revenue & Direct Sales
- Outside U.S. and Canada
Colleagues1
Injuries Per 100 Colleagues
Total injury rate in 2018 was 24% lower than in 2017
Progress on Our 2020 Environmental Sustainability Goals2
Greenhouse Gas Emissions
Total scope 1 and 2 GHG emissions
In million metric tons CO2EQ
GHG emissions in 2018 were 1.8% higher than in 2017
2020 Goals vs Baseline:
Decrease by 20%
Waste Disposed
Total hazardous and non-hazardous waste in thousand metric tons
Total waste disposed in 2018 was 3% lower than in 2017
2020 Goals vs Baseline:
Decrease by 15%
Water Withdrawal
Excluding non-contact cooling water in million cubic meters
Total water withdrawal (excluding non-contact cooling water) in 2018 5% higher than in 2017
2020 Goals vs Baseline:
Decrease by 5%


Ian Read: Contributions to Improving Human Health
Albert Bourla: Breakthroughs that Change Patients' Lives
Ushering in a New Era of Pfizer R&D Productivity
Advancing Our Leading JAK Science
Overcoming Therapy-Resistant Disease
Tackling Respiratory Syncytial Virus (RSV) Through Breakthrough Science and Technology
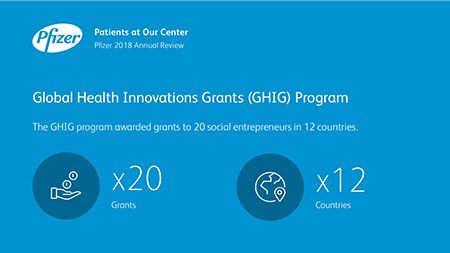
Catalyzing Innovations in Global Health
Contributing to the UN Sustainable Development Goals
Supporting Digital Health Start-Ups
Improving the Health of Women and Their Families